Concepts and ideas are currently being discussed and refined in many annual reporting projects. An important topic in these discussions surrounds developing content and presenting information in a clear and succinct way. However, reflecting on how the annual report is used and where it is read should also influence how we design our annual report.
In recent research, we found that 9 out of 10 individuals read the annual report from a screen. Accepting that our audiences today want to read and interact with our annual report content on screens should lead us to re-evaluate how we design our annual reports.
A simple test to see if your Annual Report has a design problem
You can test your own design in a very simple way. Go to your website or e-mail yourself a copy of your annual report and open it on your mobile device. Small text, formatted in parallel columns, wide tables etc. all make it very difficult to read and virtually impossible to find information.
The same is also true when looking at the PDF on a desktop or laptop.
Designing for screens and reading requires that we visualise what the report will look like on a screen and proofing of the content in the digital context. If we all did that, the annual reports that we publish online would look very different.
Different versions of digital Annual Reports
To make things even more complex there are several approaches taken by companies today. There is no single solution that will fit every organisation – companies must discuss budget, ambition and timeframe to determine which option is right them.
The most common versions are:
1. Full Annual Report designed for screen
The interactive report contains a replica of the content from the printed annual report, including notes and financial tables. In the report, the management accounts and strategy are presented in a straight-forward manner, which coincides with that of the print version. This version fulfills all the legal and fiduciary requirements of the annual report.
In addition to this, the digital format offers the possibility of adding even more value to your annual report. Added storytelling capabilities, interactive timelines, infographics and video highlights can all be used to add engagement and enable distribution via additional channels.
Pros:
- Designed for screen (multi-device).
- All the content in one place.
- Same process as a regular annual report project.
- SEO Optimised and easy to distribute.
Cons:
- Often gets “stuck” in following the structure of PDF too rigidly and does not fully use digital communication opportunities.
- Focus on disclosure data sometimes limits available resources for creative communication.
Example:
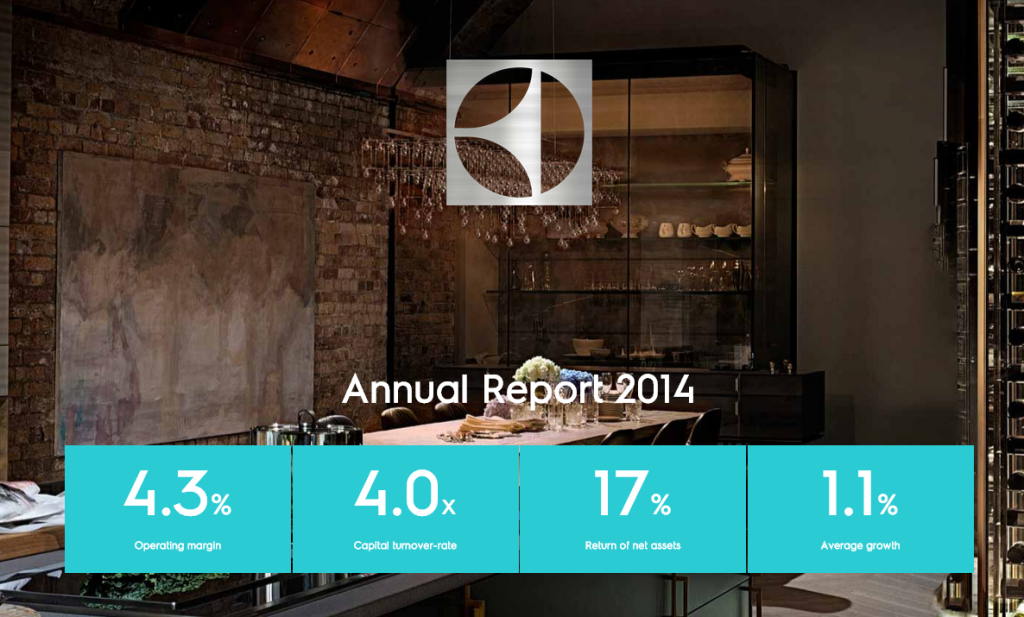
Electrolux 2014 digital annual report
2. Annual review or hybrid versions
The annual review provides a more flexible format as it isn’t the audited, disclosure driven, report. The disclosure part of the report is provided in a more traditional report format for download as PDF and or Excel document.
The presentation and communication uses digital formats such as video, infographics and shorter texts. The creative freedom is much larger and this sometimes drives up the cost of these projects as ambitions are set high. That said, this option can also be very cost efficient.
Pros:
- Freedom to create communication optimised for digital consumption.
- Designed for screen reading.
- Search engine friendly.
Cons:
- Ambition can drive up costs.
Example:
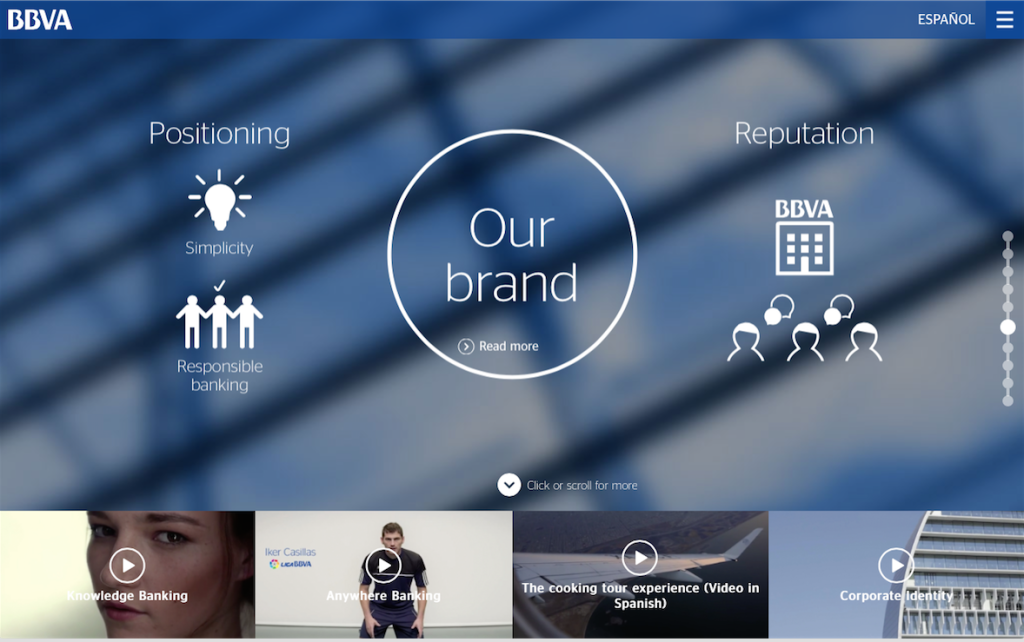
BBVA in 2014: Executive Summary
3. Annual Report integrated into the corporate site
You also have the option to integrate the annual report content into the corporate site, typically as a sub-section. This sometimes creates a long-term problem when upgrading technology or changing the website design, as the annual report for a certain year should stay the same.From a presentation and user experience point of view, this approach often creates challenges as the technology and templates used for the website rarely are optimised for annual report content. Necessary functionality such as dynamic graphs and tables are usually not available and compromises must be made.
Pros:
- Seamless with corporate site communication.
- Search engine friendly.
- Cost efficient.
Cons:
- Annual report dependent on technology, long term costs.Compromises in user experience and functionality.
Example:
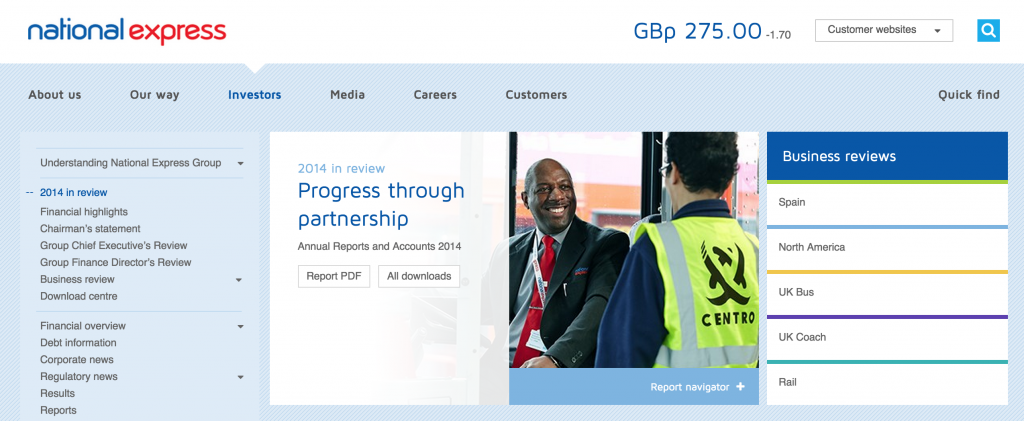
National Express
Don’t forget to hit “SEND”
The annual report is arguably the one communication product that carries the full voice of the board and management. The content and the value of the content is very high. Sadly, many reports are forgotten the day they are published, banished to the “Reports” or “Archive” section of the corporate site.
To reach the audience, be it shareholders, investors or others, the annual report project must have a distribution plan so that it will reach the intended audience. The combined traffic and print reach is very often only a fraction of what is should and could be.
Distribution can be supported by many different activities on the corporate site and in corporate social media, which will require additional content, publishing and an editorial plan.
Curious about digital annual reporting?
Don't hesitate to get in touch with us or read more about how we help companies with their corporate reports!