By Paula Brandberg Kandimaa
Are digital reports really wrong or are we just doing it the wrong way? In Comprends’ yearly surveys of the capital market up to 91% of respondents prefer a downloadable PDF as their medium for reading annual reports. The trend among Sweden’s top 100 companies is caused by a stagnation in number of digital reports available in 2016. Analysts and regular readers of financial reports say the PDF format is user friendly, dependable and makes data easy to compare to other reports.
Valuable communication tool
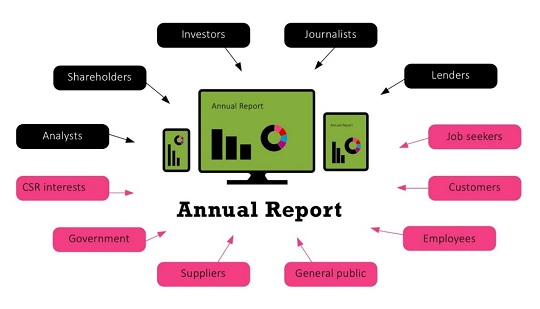
The annual report is arguably the single most important document that a listed company produces every year. Endorsed by the board and management teams, it gives the opportunity to communicate to would-be investors on a personal level as well as offering a factual representation of the years' financial results.
We see that companies are increasingly reaching out to wider groups of stakeholders. New transparency initiatives and regulation regarding sustainability reporting such as the UN Sustainable Development Goals (SDG's) mean that annual reports are no longer merely for the professional reader. Smaller investors, clients, staff and potential job seekers are increasingly using the annual report as a source of information when making their mind up about a company.
Are we still getting the format wrong?
It would be inconceivable for a large corporation in 2016 to merely adapt a suite of brochures into a corporate website yet a large number of digital annual reports are still created as a post-production from a traditional PDF. Rather than creating content meant primarily for the medium, in many cases text and images are merely reproduced on a website. Whilst the content can be found by search engines and can be shared it also means the benefit of reading the report online is not that much greater than accessing a well laid out PDF.
Using a combination of the trustworthy PDF and an online report you can maximise the ROI and increase its use over the whole year. In addition to thinking about the hard facts in producing an annual report we recommend considering:
- - What functionality can be added that actually means your company sticks out?
- - KPI comparison over time gives the reader a sense of history and context.
- - Interactive charts and graphs add transparency and show you are serious about communicating your results.
- - Provide full financials as spreadsheets to download directly into Excel or other tools.
And of course always include a full PDF - or suite of PDF's - to download for those who wish to do so.
No such thing as "One size fits all"
At Comprend, we believe that there is great potential in examining not just what you are saying about your company's performance but also how you are saying it and to whom. Take charge of the narrative - or someone else will.
Rather than believing you know who your stakeholders are, take the time to ask yourself who you are producing the digital report for. Is it most important for your company to offer a complete and detailed account of your financials or are you looking to engage with new readers? Perhaps a digital hybrid with focus on storytelling and creating an impact should be complemented with a number of documents for download? Videos, photos and big, bold, beautiful numbers displayed prominently throughout your online report can do wonders for making stakeholders feel emotionally connected to your work.
Don't forget to measure and follow up
Analysis of user data on Comprend's client 2015 annual reports shows that a healthy number of visitors are in fact using the online report throughout the year. Being able to track visitor behaviour over time is one of the great advantages of a digital report but it is also important to use metrics and set KPI's for its performance in order to get the most out of your investment and to keep improving year on year.
Measure the success of you report:
- - How do visitors access the annual report?
- - What are the visitors interested in?
- - How many visitors chose to download the report?
- - What works and what can we do more of/better?
Responsive doesn't mean Mobile first
Finally, we would strongly urge that you identify how your reports are likely to be used. Usage data and statistics can give valuable insight into which screen size, browser and type of device is being used to access your information. Although the use of mobile is steadily increasing, and certainly among millennials, there is still a predominance for annual reports to be read on desktops or laptops. Perhaps the report should offer specific design features for improved mobile performance or content should also be adapted for smaller screens. Equally, think about situations when the report needs to work on really large screens such as at an AGM or internal meeting.
Ticking off all the boxes and getting it right means increasing the interest for your company and ultimately adding value to it. Well worth taking the time and making the investment.
If you want to know more about digital annual reports, get in touch with us! Paula Brandberg Kandimaa, Senior consultant at +46 76 109 05 67 or paula.kandimaa@comprend.com.