We are now part of a new Comprend

Your partner in tech-enabled marketing and communication for transformative impact
Meet the new Comprend

October 06, 2020 Webranking

Swedish corporate websites serve the capital market well, but neglect jobseekers

 By Timmy Fredriksson & Chris Henson

På svenska

We've ranked the corporate websites of Sweden's 100 largest companies by market cap to see how closely they are meeting the needs of their stakeholders. This year's Webranking results show that while the capital market are being dealt a fairly good hand, more work is needed to service jobseekers. 

When we compare the results of the 20 largest companies across 14 of the ranked countries, Sweden places 4th with an average score of 53 (out of 100). This represents a 5.8 point decrease since last year, and the average score is also down when we look at all 100 ranked Swedish companies. This isn't specific for Swedish companies, though, as this year has seen a drop-off across the continent as stakeholder demands rise ever higher and the criteria changes to reflect modern accessibility standards. Swedish websites are still performing highly in relation to European peers, and particularly excel for the level of shareholder information available to their analysts and investors.

Share information is a feather in the cap of Swedish websites

Listed Swedish companies have a history of providing their stakeholders with an abundance of share information, and this year is no different. On average, the websites include 52% of the content most important to stakeholders. While this may sound middling, it's actually 15% more than the average of the largest 500 European companies. Share information is one of the strongest areas of Swedish communication, along with their informative homepages and corporate reporting.

Sweden's major shareholders are no secret

A particularly strong area of Swedish shareholder communication is the presentation of those who own large blocks of the companies. As many as 87% of Swedish websites include an up-to-date breakdown of all major shareholders (those with a stake of 5% or greater). There's room for improvement when it comes to adding another layer of detail, as no Swedish company currently displays the percentage of socially responsible investors who own their share. But the foundations are generally in place for keeping most of the capital market happy.

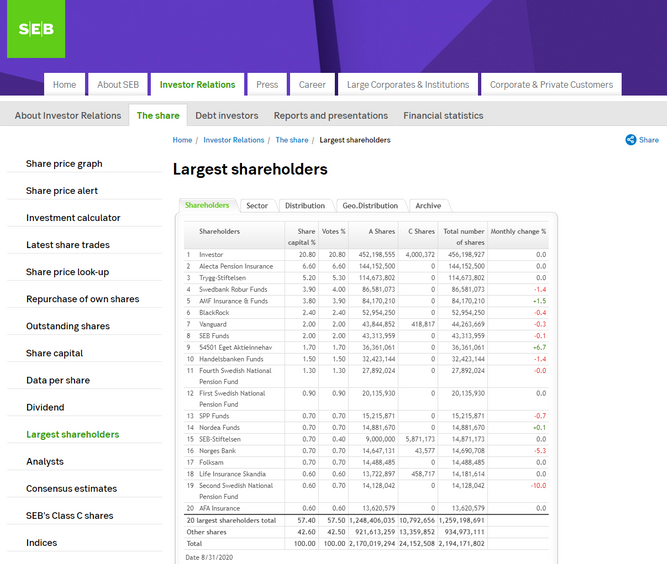
A picture of a table of the largest shareholders in the Swedish bank SEB. The picture is a screen shot of SEB's website.

SEB's shareholder coverage is fairly typical of a high-performing Swedish website. Their monitor is updated on a monthly basis and is not limited to the showing the largest shareholders. It also displays the share distribution and shareholders divided both by type and by geographical location.

Don't forget about your future employees

No matter their age or experience level, jobseekers are the future of Swedish organisations. Yet the content on the websites of Sweden's largest companies is not working hard enough to entice them in. Currently only 34% of the most important content for jobseekers is available, and this includes a display of what life is like at the companies as well as hiring information. This trails the European average by 8%, and more work is clearly needed to keep attracting top talent in an ever competitive market.

Incentives show a modern employer

When it comes to information about remuneration and benefits on offer, there's a chasm between what jobseekers want to find out and what Swedish career sites deliver. Only 15% of companies provide any degree of remuneration information, while 21% list some of the company's benefits. It's important to show that your company offers compensation systems that are at least in line with the market, and it's a nice opportunity to show off any additional perks too.

We asked jobseekers about how they use corporate websites, and the results show that companies need to be more on the ball in this area.

  • 86% of jobseekers look for a compensation policy
  • 86% look for details of the company's benefits
  • 83% want to see information on health and wellness programmes
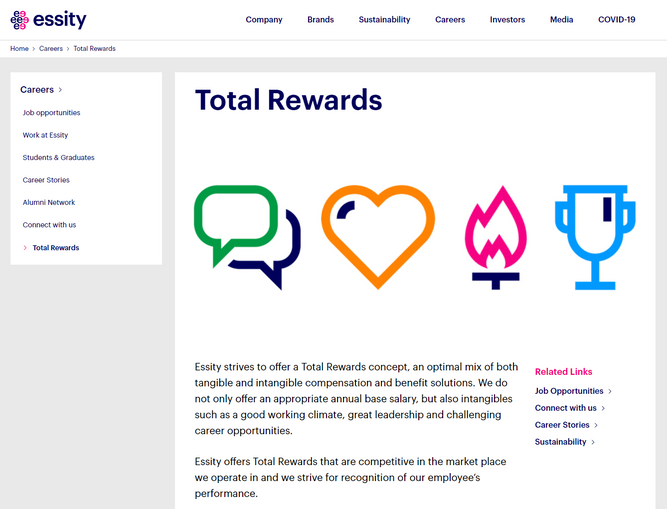
A screen shot of Swedish company Essity's website. The screen shot shows the philosophy of Essity's program "Total rewards", which is intended to give both "tangible and intangible" incentives to employees.

One company that ensures to promote their compensation and benefits systems is Essity. Their 'Total rewards' concept clarifies that the compensation is a mix of market-competitive base salary, bonus and benefits, which range from health cover to development opportunities.

The Swedish winners and the biggest climber

While the Swedish top performers mostly consists of familiar names this year, there's a newcomer to the podium - Essity. Since their initial listing in 2017, they've climbed the ranks from 39th place to 3rd this year. Swedish Match and Skanska are keeping up their great work and stand firm in 1st and 2nd place respectively. The climber of the year award goes to Bilia, who after a redesign of their website manage to increase their score by 11.6 points to 46 points. This places them in 41st compared to 90th last year.

“The Swedish Match Company website is the principal source of information about the Group and we always strive to have an easily accessible and thoughtfully designed place for people to explore our company.  We are delighted and humbled to see that the methodical work our team does is appreciated."
- Emmett Harrison, Senior Vice President, Investor Relations, Swedish Match
RankCompanyScore (out of 100)
1Swedish Match81.6
2Skanska73.4
3Essity71.3
4Cloetta68.8
5Stora Enso68.1
6SSAB67.8
7ICA Gruppen66.1
8Sandvik64.8
9BillerudKorsnäs64.2
10Holmen62.6

See the full Swedish results

Helena Wennergren

Helena Wennergren

Senior consultant

helena.wennergren@comprend.com

+46 70 971 12 10

How is your site performing?

We identify the content that investors, analysts, business journalists and jobseekers want from corporate websites to help you meet their expecations. 

Webranking

How effective is your annual report?

Our yearly review of 500 annual reports benchmarks and explains best practice to help you reach higher reporting standards. 

ReportWatch